ADEPT2 Genotyping
Candidate Gene Selection
SNP Genotyping
- Our original intent was to genotype 1,536 of the highest priority SNPs.
- We established the feasibility of using higher throughput technologies offered by Illumina (Figure 4).
- Given the cost per data point of ~$0.05 USD for this new technology, we genotyped all three association populations plus ~90 samples from two three-generation loblolly pine pedigrees for 7,600 SNPs.
- The results established the feasibility of the InfiniumTM technology within a conifer species, were consistent with those from the GoldenGateTM platform and yielded data sets ~3-fold greater in coverage of the functional gene space of loblolly pine than those proposed originally (Table 4). We have also placed ~2,000 of the candidate genes on the consensus linkage map of loblolly pine.
| Population | Purpose | n | No. SNPs | No. CGs |
| QTL | linkage | 91 | 1908 | 1749 |
| Base | linkage | 94 | 1296 | 1644 |
| WeyCo | association | 464 | 3952 | 3346 |
| NCSU | association | 437 | 3938 | 3347 |
| FBRC | association | 1003 | in progress | in progress |
Table 1. A summary of genotyping results by population. Only 493 SNPs are shared between the two pedigrees (QTL and Base), thus allowing for the potential of 2,711 SNPs to be placed on a linkage map. CG = candidate gene.
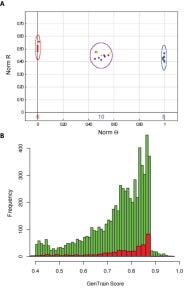
Figure 1. A summary of the pilot study used to assess the applicability of the Illumina InfiniumTM platform to loblolly pine. (A) An exemplar example of a high quality result. The test panel consisted of 24 individuals, 22 progeny and 2 parents from the QTL pedigree. Each point represents a sample, with ovals enclosing samples within the same genotypic class. Yellow points represent the genotypes of the parents. Since both parents are heterozygous, the expected segregation pattern is 1:2:1. (B) A comparison of the distribution of quality scores between the InfiniumTM (green) and GoldenGateTM (red) platforms for the same samples.
Population Structure Analysis
- We chose 23 nuclear microsatellite (SSR) markers within the loblolly pine genome that cover all 12 chromosomes.
- Genotyping was conducted for 907 individual trees comprising the WeyCo and NCSU populations.
- Using these data we employed two different Bayesian clustering algorithms to identify structure: 1) STRUCTURE and 2) TESS. The reason for using two different algorithms is that the one implemented in TESS is better at detecting clinal variation rather than discrete clustering.
- The results indicate that subtle, yet significant, amounts of population structure exist across the range of loblolly pine. Most of this structure appears clinal in nature (Figure 5A). However, it also appears that the levels of admixture are highest on the southeastern flank of the Atlantic coastal plain. This is consistent with expansion from Pleistocene refugia in southern Florida and Mexico (Figure 5B).
- The levels of admixture (i.e. the Q-values) have been supplied to all collaborators for use as covariates in the linear models used for association mapping.
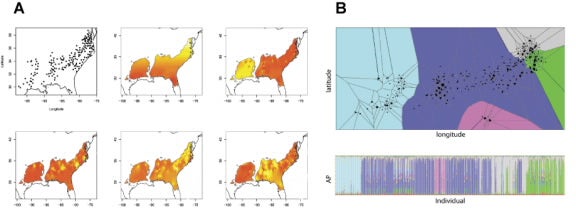
Figure 2. Patterns of population structure in loblolly pine. (A) An illustration of STRUCTURE results in two dimensions, which were smoothed using universal Kriging and general linear surface interpolation. (B) Patterns of population structure as obtained using TESS. The upper graph is a Dirichlet tessellation of the range map of loblolly pine, with polygons colored by inferred membership in one of five clusters. The bottom graph is a stacked barplot showing the membership of each sample in the five inferred clusters. Those samples with the most admixture (i.e. colors) are those from the southeastern portion of the Atlantic coastal plain.